How to Map Line Density in Buddhist Art: TK1150
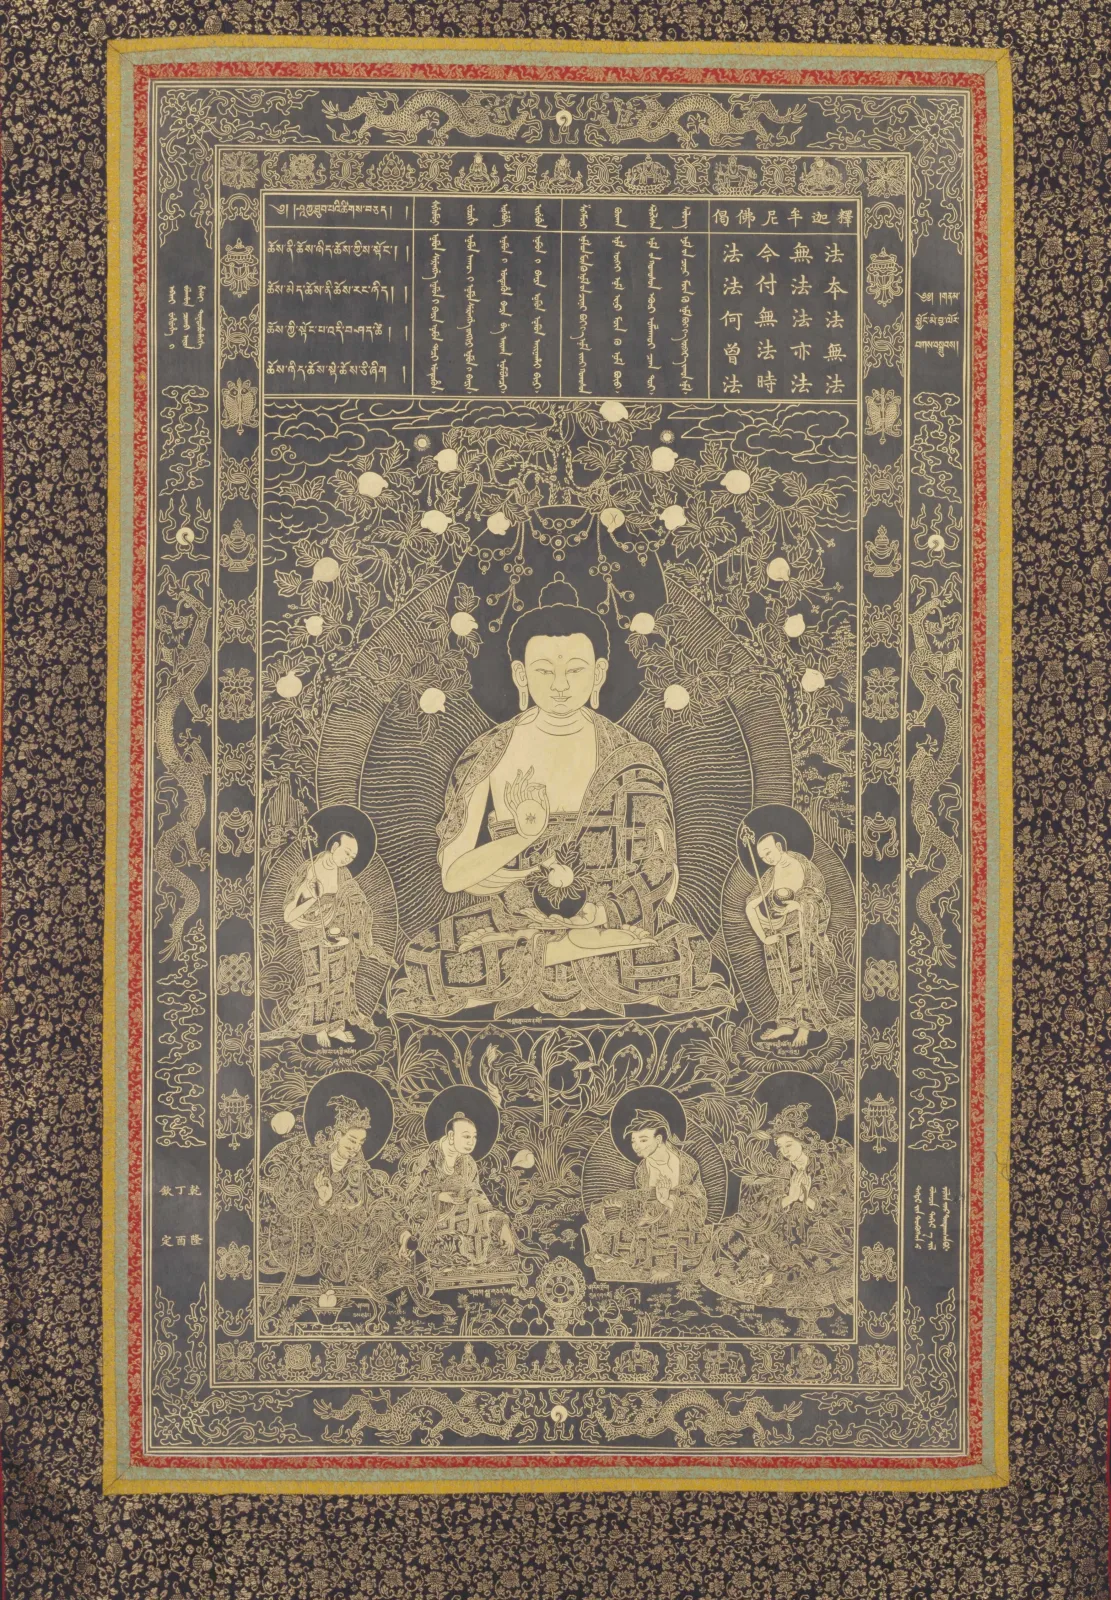
Quick answer: Line density is the amount of visible linework within a defined area. In TK1150, sparse treatment keeps the central face and torso legible, while denser foliage, robes, lower figures, inscriptions, and borders carry detail. Mapping these changes explains visual hierarchy without assuming a material, date, or workshop.
A densely ornamented Buddhist image can look uniform when viewed as a thumbnail. At closer scale, however, its surface is divided into zones with very different amounts of linework. Some areas contain broad uninterrupted fields; others pack contours, hatching, lettering, textile patterns, leaves, fruit, clouds, and small figures into a narrow space.
TK1150 is especially useful for studying line density in Buddhist art. A large seated Buddha occupies the center beneath a multiscript panel and fruiting canopy. Two standing figures flank the body, four smaller haloed figures sit below, and dragons and auspicious motifs fill the borders. The image remains readable because density changes from zone to zone rather than staying equally intense everywhere.
What does line density mean in image analysis?
Line density describes how much linework appears inside a consistent sample area. A zone with many short contours, hatching marks, letters, or overlapping patterns has high density. A zone dominated by an open tone or a simple silhouette has lower density.
This is a visual category, not a claim about technique. In a digital file, pale lines may reproduce thread, paint, ink, printing, or another process. Unless a physical examination or reliable object record confirms the material, “gold-colored linework on a dark ground” is safer than naming gold pigment or embroidery.
Where is line density lowest in TK1150?
The lowest-density areas appear across the central Buddha’s pale face, neck, and upper torso and within parts of the dark aureole. These calmer fields create immediate separation from the dense canopy, patterned robes, and flanking figures.
The face contains essential features—brows, eyes, nose, mouth, ears, and hairline—but avoids the packed ornament found elsewhere. The torso also retains relatively broad pale areas. This controlled reduction lets the main figure remain legible at small viewing sizes even though the surrounding composition is extremely detailed.
Which zones have the highest line density?
The densest zones are the fruiting foliage, the patterned garments, the lower assembly, and the decorated borders. Each concentrates many small contours, but the marks perform different jobs.
Leaves and branches create organic repetition around the aureole. Robe patterns divide folds and textile panels. The four lower figures combine faces, halos, clothing, seats, and ritual-looking objects in a compressed register. Border bands add dragons, cloud forms, hanging ornaments, and small repeated emblems. A density map should record these zones separately instead of treating all detail as one texture.
How does the text panel differ from the foliage?
The text panel uses organized rather than tangled density. Its characters and script lines are numerous, but they sit inside ruled compartments with comparatively open dark fields between strokes. The grid creates predictable spacing that differs from the branching rhythm of the canopy below.
This distinction matters because equal line counts can produce different visual effects. A regular column of characters may feel stable, while the same number of intersecting leaves may feel more complex. Researchers should therefore pair quantity with a description of direction, repetition, and enclosure. The scripts are visible, but their complete transcription and translation remain outside this visual analysis.
| Zone | Relative density | Visible line behavior |
|---|---|---|
| Central face and torso | Low | Few essential contours across broad pale fields |
| Aureole interior | Low to medium | Dark field with radiating or nested boundaries |
| Multiscript panel | Medium | Repeated strokes separated by ruled cells |
| Foliage and robes | High | Overlapping organic contours and textile patterns |
| Lower figures and borders | High | Compressed bodies, objects, dragons, clouds, and emblems |
How do you create a reproducible line-density map?
Create the map by sampling equal-sized areas and recording both line quantity and line behavior. Work on a derivative so the source file remains unchanged.
- Define the pictorial field. Separate the inner image from the outer textile-like surround and mounting bands.
- Add an equal grid. Use square cells with documented pixel dimensions; do not resize the image between samples.
- Mark line-rich pixels. Apply one consistent contrast threshold, then inspect the result against the original.
- Count or rank each cell. Record a percentage, line count, or cautious low–medium–high category.
- Name the visible forms. Note whether density comes from text, foliage, garments, faces, halos, objects, or borders.
- Check compression artifacts. Exclude block edges, sharpening halos, dust, and noise that do not belong to the depicted design.
- Return to full view. Confirm that the measured pattern explains what remains legible at reduced size.
Why should line quantity and line direction be recorded separately?
They should be separated because two areas can contain similar amounts of linework but guide the eye differently. Parallel strokes create a stable flow; radial lines reinforce a center; crossed contours make a cluster feel compact; isolated outlines preserve individual forms.
In TK1150, the aureole uses curved and radiating bands around the central body, the text panel favors vertical and horizontal order, the trees branch outward, and garment patterns follow the figures’ bodies. Density tells us how much is present; direction explains how that detail participates in the composition.
How does image resolution affect the map?
Resolution affects what can be counted, so comparisons must use the same sampling scale. TK1150 is a 3539 × 5098-pixel RGB JPEG, which reveals small characters, leaf veins, garment grids, and border motifs more clearly than a reduced web copy.
More pixels do not automatically prove more authentic detail. Sharpening, resampling, compression, or digital retouching can create or suppress edges. A responsible map records the source dimensions, checksum, derivative dimensions, software, threshold, and date. It also distinguishes visible detail from any later reconstruction.
Can line density identify the figures or the artwork’s origin?
No. Density can demonstrate visual hierarchy and regional differences within the image, but it cannot securely name a Buddha, date an object, identify a workshop, or establish provenance. Those conclusions require inscriptions, iconographic attributes, comparative objects, technical examination, and traceable documentation.
The archive title links TK1150 with the Seven Buddhas of the Past and Shakyamuni Buddha. Seven principal figures are visible—one large central figure, two standing figures, and four smaller figures below—but the count alone does not resolve the title’s wording or individual identities. The filename is evidence about the archive, not proof about a physical object.
What remains uncertain in TK1150?
The exact identities of the seven visible figures, the full readings of the scripts, the meaning of small hand-held forms, and the relationship among the figures remain uncertain. The date, maker, materials, production method, school, collection, provenance, and physical-object history are also uncertain.
Direct visual evidence is more secure: a dark ground, pale and gold-colored linework, a framed text panel, fruiting canopy, central seated Buddha, paired standing figures, four lower haloed figures, lotus seat, dragons, repeated emblems, and deliberate shifts from sparse to dense linework.
Frequently asked questions
Is line density the same as visual complexity?
No. Density measures the amount of linework in an area, while complexity also includes direction, overlap, color, scale, repetition, and the viewer’s ability to group forms.
Can I compare density across two differently sized files?
Only after normalizing the sampling scale and documenting any resampling. Counting raw pixels in unequal files can make the larger image appear denser simply because it contains more samples.
Should text strokes be counted with painted contours?
Count them in the overall map, but label text as a separate source of density. This preserves the difference between linguistic marks and pictorial contours.
Does a dense border make the central figure less important?
Not necessarily. Dense borders can contain and frame a calmer center. Scale, placement, tonal contrast, direction, and surrounding open fields can keep the principal figure dominant.
Conclusion
TK1150 shows that dense Buddhist art is not uniformly crowded. Sparse treatment clarifies the central face and torso, while text, foliage, garments, lower figures, and borders use distinct kinds of concentrated linework. By sampling equal areas, recording direction and source, and excluding digital artifacts, a line-density map can explain hierarchy without turning visible structure into unsupported attribution.
Sources and editorial method
This article is based on direct visual analysis of the TANGKAWORLD TK1150 image. Visible line evidence, religious identification, and uncertain historical attribution are treated as separate levels. The editorial method uses full-image review, equal-area sampling, line-source labeling, direction comparison, artifact checks, and explicit confidence labels; the filename is not treated as a verified museum record. For a reusable high-resolution workflow and further references, consult How to Study Thangka Iconography with High-Resolution Images.
Prepared and reviewed by the TANGKAWORLD editorial team. Last reviewed: September 15, 2026.

